
Understanding and interpreting electric motor performance curves may seem complicated, but ISL is here to help! While it may look like an overwhelming, random combination of intersecting lines, the graph is actually a very efficient method of illustrating a motor or gear motor performance and capabilities. Our goal in this design note is to make it easier for you to understand and interpret performance curves that are commonly found on motor or gear motor datasheets.
Shop DC Motors & Gear Motors at Digi-Key
Understanding The Basics
A motor / gear motor performance curve conveys five specific parameters; speed, torque, current draw, power and efficiency. The overall performance data will illustrate the optimal conditions the motor should operate at as well as its limitations. This information can be used to determine if the motor will be ideal for your application or device.
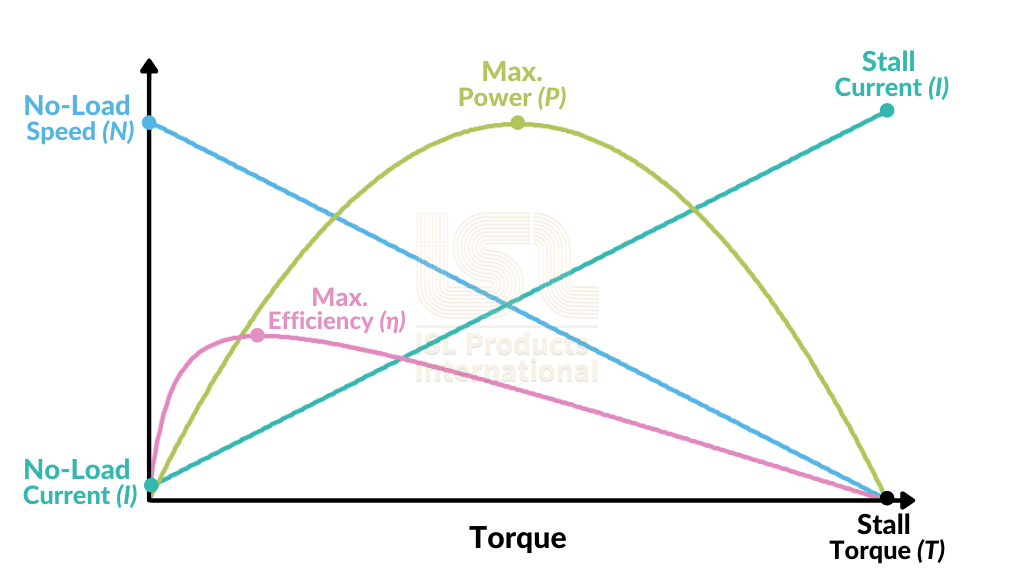
Speed (N)
Measured in revolutions per minute (rpm), this straight, downward sloping line shows the relationship between torque and speed over the entire power-band (see blue line in example above). Since speed and torque are indirectly proportional to one another, this line will decrease linearly as torque increases up until the stall point, at which the speed will be 0 rpm.
Speed and torque have an inverse relationship. The speed is highest when the motor is producing the least torque, and when the torque is highest the motor is barely turning.
Efficiency (η)
Efficiency is a relationship between the input power and output power, given as a percentage (%). This line is more or less parabolic with the vertex more towards the lower torque values (see pink line in example above). It typically peaks early on in the torque range then slowly decreases as the motor gets closer to its stall torque.
Using the motor near it’s peak efficiency ensures optimal motor life and power consumption. It is best practice to use a motor at or near its peak efficiency. The further away a motor gets from max efficiency, its performance becomes less reliable.
Torque (T)
Whether measured in kg-cm, lb-in, or Nm, torque is the amount of load the motor or gear motor output shaft can overcome. On a dc motor / gear motor performance curve, torque is usually represented by the X-axis.
The intersection of the speed line (N) and the X-axis is the stall torque (T) point. This is where the motor produces its maximum torque and can no longer rotate. Make sure that the force needed from the motor is much less than the overall torque capacity (stall torque), otherwise the motor will not work as intended and will have a high risk of being damaged.
Current (I)
Represented by the straight ascending line (see teal line in example above), this reflects current draw from no load to stall conditions. This line shows the direct relationship between amperage and torque.
If your application is power conscious, it would be best practice to operate the motor at peak efficiency. This gets the most balanced performance out of the motor while demanding a reasonable amount of current. During motor performance evaluation, noting the current draw will allow you to more accurately understand the on-load conditions a motor sees within your application.
Output Power (P)
Possibly the simplest number on the whole graph, Output Power shows how much power (in Watts) a motor can deliver (see green line in example above).
Power is a measurement of work over time and is usually illustrated by a standard parabolic shape. The motor’s power depends on both speed and torque, the power is low when speed is high and torque is very low. The opposite situation is also true, when speed is low and torque is high the power will also be low. This means power usually peaks at the midpoint between the maximum speed and the stall point.
Performance Curve Interpretation
Now that we have covered the basics, you can begin to understand what the lines and numbers represent. The performance curve below is a more detailed performance representation for a typical dc gear motor. We will use this curve as a frame of reference to help explain how to properly determine the overall performance aspects and other important factors like the rated performance.
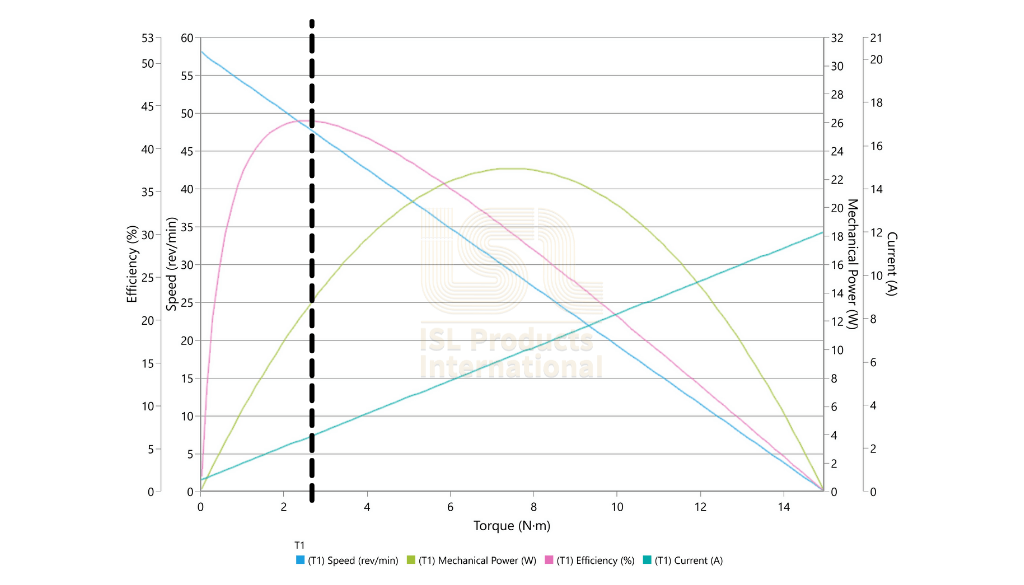
Here are the specific specifications based on the gear motor performance curve above:
| Parameter | Value | Unit |
| No-Load Speed | 58 | rpm |
| No-Load Current | 0.5 | A |
| Rated Speed | 48 | rpm |
| Rated Torque | 2.5 | Nm |
| Rated Current | 2.5 | A |
| Rated Power | 12.8 | W |
| Max. Efficiency | 43 | % |
| Max. Power | 22.7 | W |
| Stall Torque | 15 | Nm |
| Stall Current | 12 | A |
Gear Motor performance curves give you an opportunity to evaluate a motor on paper to see if it’s the most optimal choice for your application. By comparing your applications desired performance to the graph you can theoretically test the motor before samples are made. As with any other electromechanical component, you want it to operate as efficiently as possible. You can use the performance curve to easily determine the motor or gear motors maximum efficiency point or rated performance.
Rated Performance
To find the rated or nominal operating performance of a motor / gear motor, the first step is to locate the peak efficiency point (pink line). In the graph above, the peak efficiency is at 43%. Once you locate the maximum efficiency point, draw a vertical line through that point (see black dotted line), from the top of the graph to the bottom to determine all other rated performance parameters. Each time your vertical line intersects with another line within the graph, it indicates each of the rated performance values.
Using the graph above, the rated performance of this gear motor would be: 2.5Nm / 48 rpm/ 43% / 2.5A / 12.8W.
* Please note that there are usually multiple parameter scales on Y-Axes.
Continuous and Intermittent Usage
Electric motors have two types of usage which are defined by torque capacity in which they are operating at. These ranges are meant to depict the overall safe operating limits of the motor or gear motor. Defining your overall duty cycle is a key factor when determining the type of usage range a motor or gear motor will be operating within.
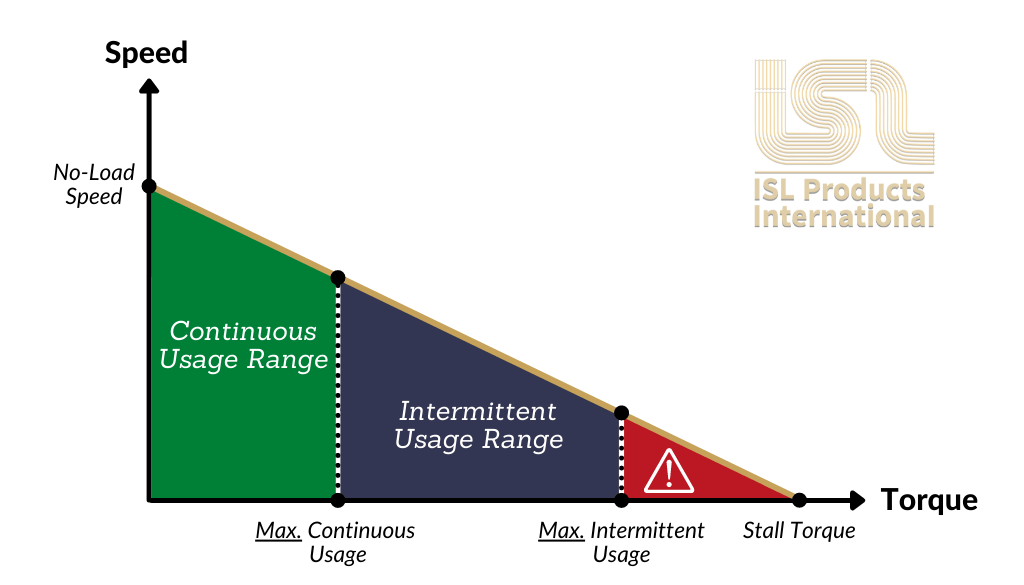
Continuous Usage Range
This occurs between 0% and 30% of the overall torque capacity (stall torque). This range encompass the motors max efficiency point and can operate consistently without risking premature failure. Within this range thermals are not an issue, as long as the ambient temperature is not excessively high. This is the safest range to operate the motor.
Intermittent Usage Range
This range falls between 30% and 60% of the overall torque capacity. This is where the motor can perform sporadic tasks, but should not run consistently in order to sustain general motor health. Implementing active cooling can allow motors to operate here for longer periods of time and have less frequent dwell times. Keep in mind, the further you move away from the max efficiency point, the higher the current draw will be and also the chances of premature failure increase.
Danger Zone
We will refer to this area above 60% of the torque capacity. It is highly advised that you do not operate a motor in this area! At these loads the motor will overheat quickly, increasing the chance of the motor winding burning out and/or gearbox failure, if equipped.
While these are useful approximations when selecting a motor or gear motor, they are not concrete rules. Please use this information as a frame of reference to help aid in your motor selection. It’s always best to check with your motor vendor or supplier to make sure the motor you are picking is the optimal selection for your application and duty cycle. An ISL Products applications engineer can assist with all of these aspects. Contact them today with any questions!
Conclusion
We hope that this explanation has helped you get more familiar with motor and gear motor performance curves. Not all vendors or manufacturers will offer all of the motor data so if a certain parameter is missing, please inquire about it.
As with all things, understanding these performance data sheets is only one part of the motor selection process. If you’re having trouble with your motor selection, just let our engineers know, they are here to help! Check out our design note and learn how our application engineers can save you over 10 hours of research during the motor selection process.
ISL Products has decades of experience providing OEM’s with application specific DC motor and gear motor solutions. Submit an inquiry through our quick and easy 3-Step Motor Selection Guide to get started today.
